Skip to content
English
  • There are no suggestions because the search field is empty.

How can I upload a Custom Dose Response Dataset?

The Custom Dose Response Upload lets you upload your own processed dose-response tables and visualise them with the same modules used for datasets built directly in Mass Dynamics.

Steps to upload your Custom Dose Response Dataset

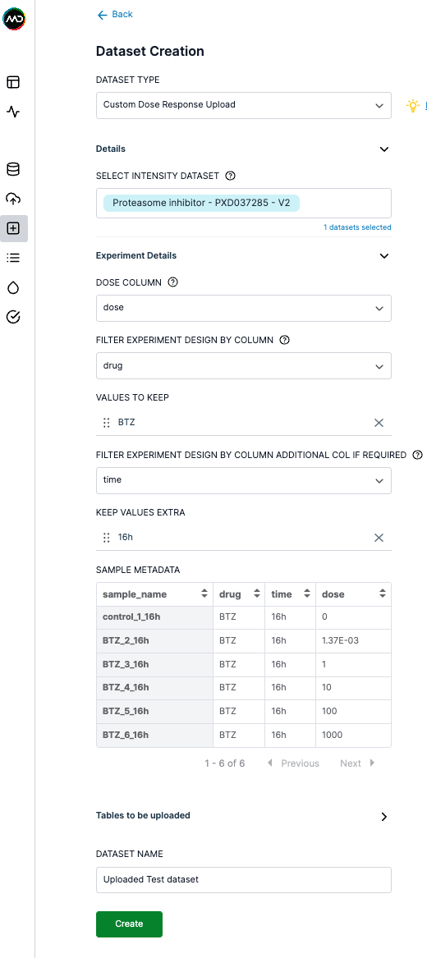
  1. Go to the Dataset Creation page and select Custom Dose Response Upload.
  2. Select the Intensity Dataset you want to link the upload to.
  3. As with a standard dose-response dataset, use "Filter Experiment Design by Column" to specify which samples in your experiment design the uploaded dataset corresponds to. This step is required so your upload behaves like a dataset processed directly on the platform: able to be filtered, compared, and visualised alongside the rest of your data.
  4. Upload your four tables: output_volcanoes.tsv, output_curves.tsv, input_drc.tsv, and runtime_metadata.tsv. Each table is checked against its required columns before the dataset is created.
  5. Your tables need to follow the same structure originally used for the 4-parameter log-logistic (LL4) regression from the standard Mass Dynamics dose-response workflow. If you used a different model, your tables still need to conform to this structure for the visualisations to work. You can download an example dataset here to use as a template.
  6. Once the dataset is uploaded and completes processing, get started exploring your dose-response curves and volcano plots!


Custom Dose Response Upload creation page.

You can download here an example small dataset with all the required tables for the upload.  
Below, each table's required columns are described in detail, along with what every column means in the standard Mass Dynamics workflow.

For every column, the Notes column tells you:

  • Whether it's Required for visualisation: read directly by the dose-response curve plot, volcano plot, or cross-plot entity selection, so it needs a real value;
  • Or Not used for visualisation: needed to pass the upload's column checks, but a placeholder (e.g. NA) is fine if you don't have a real value. 

Example File: output_volcanoes.tsv

Data behind the dose-response volcano plot for a single dataset including the effect magnitude, significance, and goodness-of-fit for each protein's model.

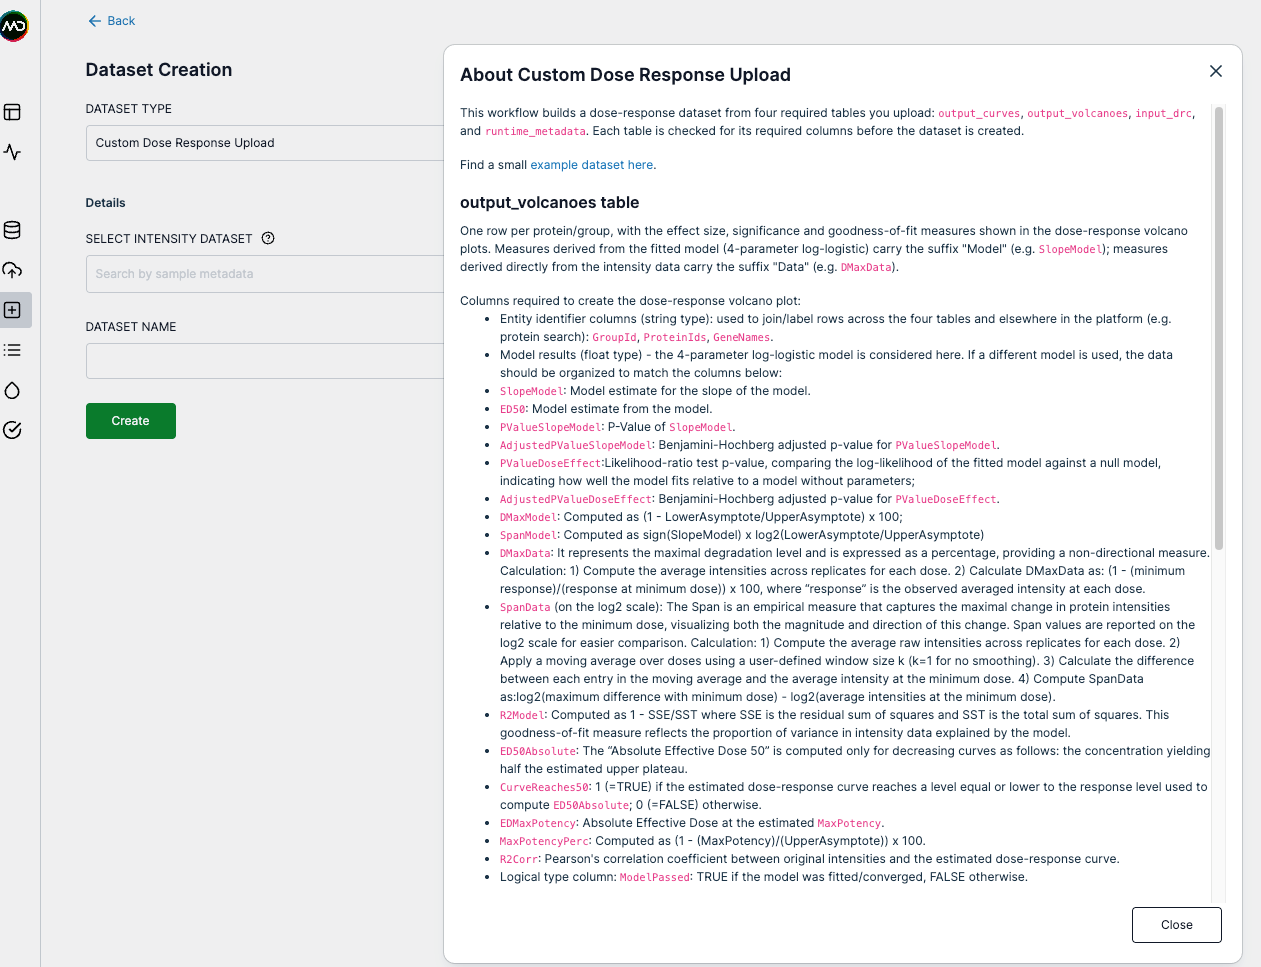
The LL4 model estimates four parameters: 𝑏 (slope), 𝑐 (lower asymptote), 𝑑 (upper asymptote), 𝑒 (ED50). Measures derived from these estimated parameters carry the suffix Model; measures derived directly from intensity data carry the suffix Data.

Column Name

Notes

GroupId, ProteinIds, GeneNames (Primary keys)

Required for visualisation. Entity identifiers: need real, matching values with the rest of the dataset. Used to join/label rows across all four tables and to power entity selection between plots.

SlopeModel

Required for visualisation. Model estimate for the 𝑏 parameter: steepness of the dose-response curve (Hill Slope).

ED50

Required for visualisation. Model estimate for the 𝑒 parameter: the dose at which there's a 50% reduction in average intensity relative to the model's upper/lower limits.

PValueSlopeModel

Required for visualisation. P-value of the SlopeModel (𝑏) parameter.

PValueDoseEffect

Required for visualisation. Likelihood-ratio test p-value comparing the fitted model against a null model: reflects how well the model fits.

DMaxModel

Required for visualisation. Maximal degradation, computed as (1 − 𝑐/𝑑) × 100.

SpanModel

Required for visualisation. Computed as sign(𝑏) × log2(𝑐/𝑑). May not always agree in direction with SpanData, especially for poorly-fitting curves.

R2Model

Required for visualisation. Goodness-of-fit: 1 − SSE/SST: proportion of variance in intensity data explained by the model.

DMaxData

Required for visualisation. Maximal degradation (%), computed directly from the data: (1 − minimum response / response at minimum dose) × 100.

SpanData

Required for visualisation. Empirical, log2-scale measure of the maximal intensity change relative to the minimum dose. Positive = increases with dose; negative = decreases.

ED50Absolute

Required for visualisation. Computed only for decreasing curves: the dose yielding half the estimated upper plateau (𝑑) or the mean response at the lowest dose, depending on absolute_ed50_source.

CurveReaches50

Required for visualisation. 1/TRUE if the estimated curve reaches a level at or below the response level used for ED50Absolute; 0/FALSE otherwise.

EDMaxPotency

Required for visualisation. Absolute Effective Dose at the estimated MaxPotency.

MaxPotencyPerc

Required for visualisation. Computed as (1 − MaxPotency / Upper Plateau) × 100.

R2Corr

Required for visualisation. Pearson's correlation coefficient between the original intensities and the estimated dose-response curve.

AdjustedPValueSlopeModel

Required for visualisation. Benjamini-Hochberg adjusted p-value for SlopeModel.

AdjustedPValueDoseEffect

Required for visualisation. Benjamini-Hochberg adjusted p-value for PValueDoseEffect.

ModelPassed

Required for visualisation. TRUE/FALSE: whether the model was fitted/converged.

GroupLabel, Description

Not used for visualisation. Protein-metadata style string fields, placeholder OK.

UpperAsymptote

Not used for visualisation. Model estimate for the 𝑑 parameter, placeholder OK.

LowerAsymptote

Not used for visualisation. Model estimate for the 𝑐 parameter, placeholder OK.

ED50AbsoluteRespLevel

Not used for visualisation. The response level used as the basis for ED50Absolute, placeholder OK.

MaxPotency

Not used for visualisation. By default, the average intensity at the two highest doses or the lower plateau 𝑐, depending on max_potency_source, placeholder OK.

IsCurveDecreasingData

Not used for visualisation. 1/TRUE if the mean intensity at the lowest dose exceeds the mean intensity at the highest dose (decreasing, based on raw data), placeholder OK.

IsCurveDecreasingModel

Not used for visualisation. 1/TRUE if the estimated slope (𝑏) of the LL4 model is positive, placeholder OK.


Example File: output_curves.tsv

The predicted dose-response curve for each protein including one row per point on a dose grid spanning the input data's dose range, used to draw the curve plot. Shares several fitted-model measures with output_volcanoes, narrowed to the curve-plotting subset.

If the actual minimum dose is 0, the minimum dose on the grid is set to the smaller of 0.1 and the mean of 0 and the second-lowest dose, to avoid taking log(0).

Column Name

Notes

GroupId, ProteinIds, GeneNames (Primary keys)

Required for visualisation. Same as in output_volcanoes: need real, matching values for joining, labelling, and entity selection.

Dose

Required for visualisation. The grid of doses the predictions were computed for: x-axis of the curve plot.

DrcPred

Required for visualisation. The predicted response at each Dose, from the fitted model (R's predict()).

SpanData

Required for visualisation. Same meaning as in output_volcanoes: drives per-curve annotation text.

ED50

Required for visualisation. Same meaning as in output_volcanoes.

SlopeModel

Required for visualisation. Same meaning as in output_volcanoes.

ED50Absolute

Required for visualisation. Same meaning as in output_volcanoes.

CurveReaches50

Required for visualisation. Same meaning as in output_volcanoes.

EDMaxPotency

Required for visualisation. Same meaning as in output_volcanoes.

MaxPotencyPerc

Required for visualisation. Same meaning as in output_volcanoes.

GroupLabel, Description

Not used for visualisation. Protein-metadata style string fields, placeholder OK.

ModelPassed

Not used for visualisation. Same meaning as in output_volcanoes, placeholder OK.

DrcPredMin, DrcPredMax

Not used for visualisation. 95% confidence limits of the prediction: computed but not currently plotted, placeholder OK.

UpperAsymptote, LowerAsymptote

Not used for visualisation. Model estimates for 𝑑 and 𝑐, placeholder OK.

R2Corr

Not used for visualisation. Same meaning as in output_volcanoes, placeholder OK.

DMaxData

Not used for visualisation. Same meaning as in output_volcanoes, placeholder OK.

IsCurveDecreasingModel

Not used for visualisation. Same meaning as in output_volcanoes, placeholder OK.

MaxPotency

Not used for visualisation. Same meaning as in output_volcanoes, placeholder OK.


Example File: input_drc.tsv

The per-replicate input data used to fit the models including one row per protein / replicate / dose combination.

Column Name

Notes

GroupId, ProteinIds, GeneNames (Primary keys)

Required for visualisation. Same as above: need real, matching values.

replicate

Required for visualisation. The sample/replicate identifier, shown in the curve plot's hover text.

Imputed

Required for visualisation. 1/0 flag: draws imputed points as diamonds vs. observed points as circles on the curve plot. In the standard workflow this comes from Mass Dynamics' initial preprocessing; no imputation happens while building the dose-response dataset itself.

Dose

Required for visualisation. The range of doses available in the data: x-axis values for the plotted points.

InitialIntensity

Required for visualisation. The initial intensities from the input data, before normalisation or log transformation: the plotted y-axis value.

GroupLabel, Description

Not used for visualisation. Protein-metadata style string fields, placeholder OK.

ResponseIntensity

Not used for visualisation. The (normalised/transformed) intensities actually used to fit the models, placeholder OK.

ConditionHasEnoughReplicates

Not used for visualisation. TRUE/FALSE: whether a given protein/dose has enough replicates with non-missing values, per prop_required_replicates. Only drives filtering in the standard run_dose_response pipeline; not re-read once a dataset is uploaded here. Placeholder OK.

GroupIdHasEnoughConditions

Not used for visualisation. TRUE/FALSE: whether a protein has enough conditions meeting the replicate requirement, per prop_required_conditions. Same note as above. Placeholder OK.

GroupIdHasEnoughValues

Not used for visualisation. TRUE/FALSE: whether a protein has enough non-missing intensity values overall, per prop_required_in_protein (default 0.5). Same note as above. Placeholder OK.


Example File: runtime_metadata.tsv

A single-row table recording the settings used to produce the dataset. No specific columns are enforced on upload: only the file itself is required. None of its columns are read by the curve, volcano, or summarised-table visualisation modules, so it's for record-keeping only: any values, including placeholders, are acceptable.

In the standard workflow, this table typically records:

Column Name

Notes

Normalisation

The method used to normalise the intensity data.

MinPropRequiredInProtein

Minimum proportion of data required for a protein to be included in the dataset.

SpanObsRollmeanK

The 𝑘 value used in the rolling mean when calculating SpanData.

IsIntensityLogTransformed

Whether intensity data has been log-transformed.

UseImputedIntensities

Whether imputed intensity values are used.

R_version

The version of R used to create the dataset.

DoseResponseMDVersion

The version of the DoseResponseMD R package used.

DigitsRoundingDrcModel

Number of rounding digits used for the analysis (applied via options(digits = ...)).

AdjPvalMethod

Method used to adjust p-values for multiple comparisons (default: Benjamini-Hochberg).

InputIntensityColumn

The column in the input dataset containing intensity values (default: NormalisedIntensity).

InputDoseColumn

The column in the input dataset containing dose values (default: dose).

DrcModelType

The dose-response model type applied (default: LL4).

MinPropReplicates

Minimum proportion of replicates required per dose (default 0 = no filter).

MinPropConditions

Minimum proportion of conditions required in the dataset (default 0 = no filter).

OptimRelativeTolerance

Relative tolerance passed to R's optim() during model fitting (default: 1e-10).

MaxPotencySource

Data source ("model" or observed "intensity") used to compute maximum potency, for decreasing curves.