![MD-logo-circle-alt-colour.png]](https://help.massdynamics.com/hs-fs/hubfs/MD-logo-circle-alt-colour.png?width=40&height=40&name=MD-logo-circle-alt-colour.png)
Why this happens?
When your upload finishes, Mass Dynamics creates an intensity dataset. That's your measured protein, peptide or PTM levels for every sample. QC modules and heatmaps can read it straight away, which is why those work.
Pairwise modules answer a different question: what changed between group A and group B? They need a pairwise comparison dataset. That dataset holds the statistics for each comparison you choose, such as fold changes and p-values.
Think of the intensity dataset as your raw measurements. The pairwise dataset is the analysis of those measurements. Until you create one, the dataset list in a pairwise module has nothing to show.
Anna Quaglieri walks through how to create a pairwise comparison dataset from your uploaded dataset in this quick video.
Prefer to read? The steps are below.
Create a pairwise comparison dataset
You'll need an upload with status Completed, and sample metadata that includes the groups you want to compare (for example a condition column).
1. Open Create a dataset
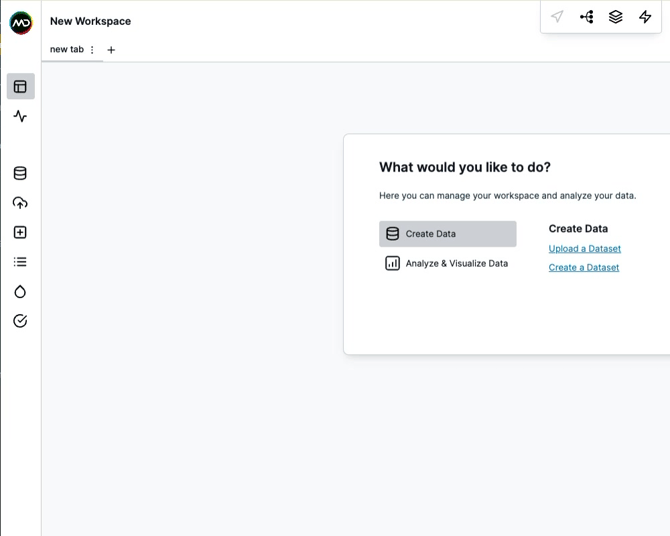
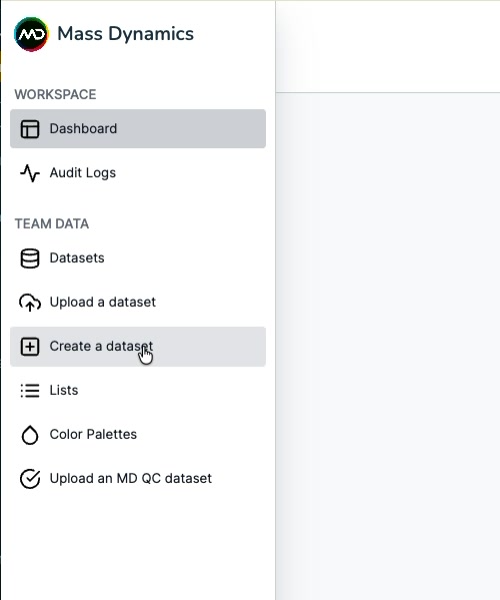
In your workspace, click Create Data → Create a Dataset. Or click the Mass Dynamics logo (top left) and choose Team Data → Create a dataset.
2. Choose the dataset type
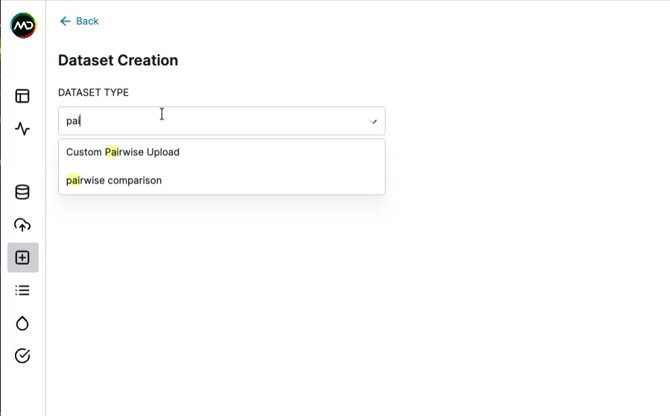
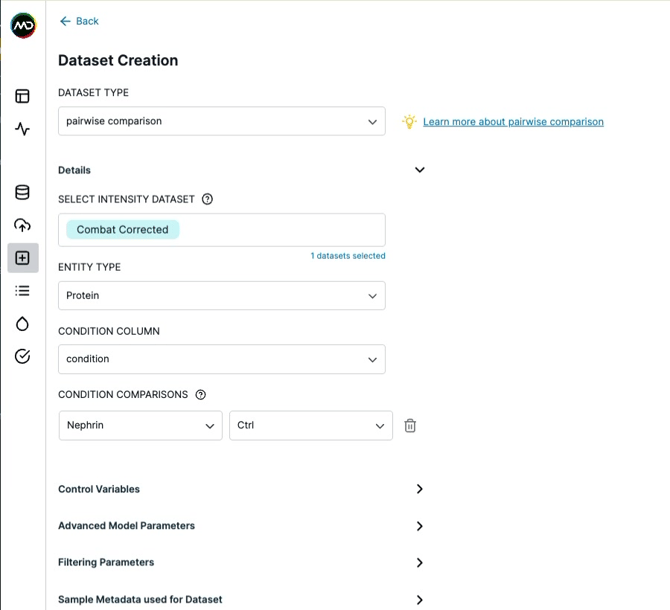
Under Dataset type, pick pairwise comparison. You can type "pai" to filter the list.
3. Select your intensity dataset
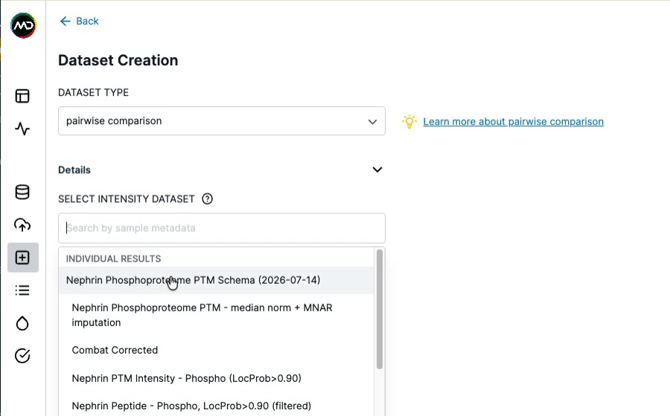
Under Select intensity dataset, choose the intensity dataset that came from your upload. It usually has the same name as your upload.
4. Set up the comparison
- Entity type: what to compare, for example Protein.
- Condition column: the column in your sample metadata that holds your groups, for example
condition. - Condition comparisons: pick the two groups to compare, for example Treated vs Control. You can also compare one group against All other conditions.
- Leave Control Variables, Advanced Model Parameters, Filtering Parameters and Sample Metadata on their defaults for your first run.
- Give the dataset a name you'll recognise, then click Create.
5. Wait for it to finish
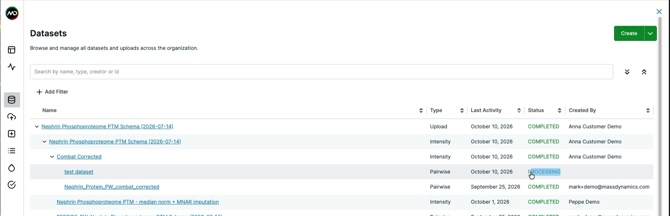
You'll see a green Dataset created message. Your new dataset appears in Datasets, nested under the intensity dataset it came from. Its status shows Processing, then Completed when it's ready to use.
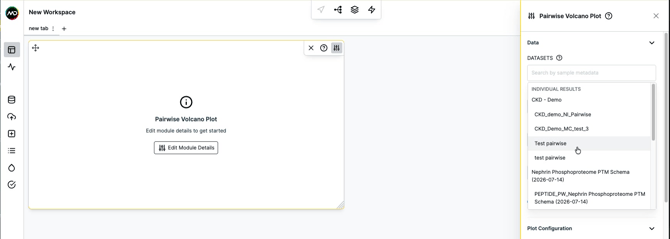
- In your workspace, add a pairwise module, for example Pairwise Volcano Plot.
- Click Edit Module Details.
- Under Datasets, pick your new pairwise dataset.
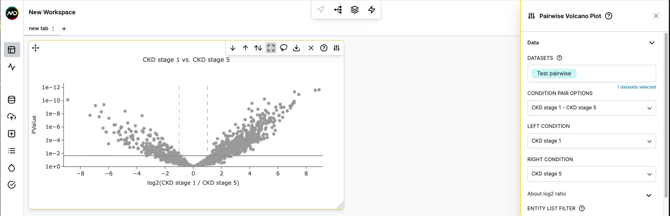
- Choose the Condition pair, then click Save Changes.
Your plot appears straight away.
- Is the dataset still processing? It only appears in modules once its status in Datasets shows Completed.
- Is it the right kind of dataset? Pairwise modules list pairwise comparison datasets only. An intensity dataset won't show up there.
- No groups to pick in Condition column? Your sample metadata needs a column that says which group each sample belongs to.
Still stuck? Contact us and tell us the name of your upload. We'll take a look.