While freely available R packages and software can be used to generate plots such as volcano, violin, heatmap, PCA etc. to assess data quality and generate insights, our members make the shift to Mass Dynamics to streamline the generation and interrogation of analyses, increase capacity to support high-throughput studies, and improve the way to collaborate and share results with all stakeholders.
The service achieves this by providing:
- Accessible information: Any member can use the service anytime, anywhere, via a web browser.
- Rapid insights: When you create visualizations and results, these remain in the experiment - you can return to where you left off - no need to re-generate plots every time
- Technical excellence: Prioritizes latency, performance, and scale (no experiment size constraints). Architected to scale into any -omics or application.
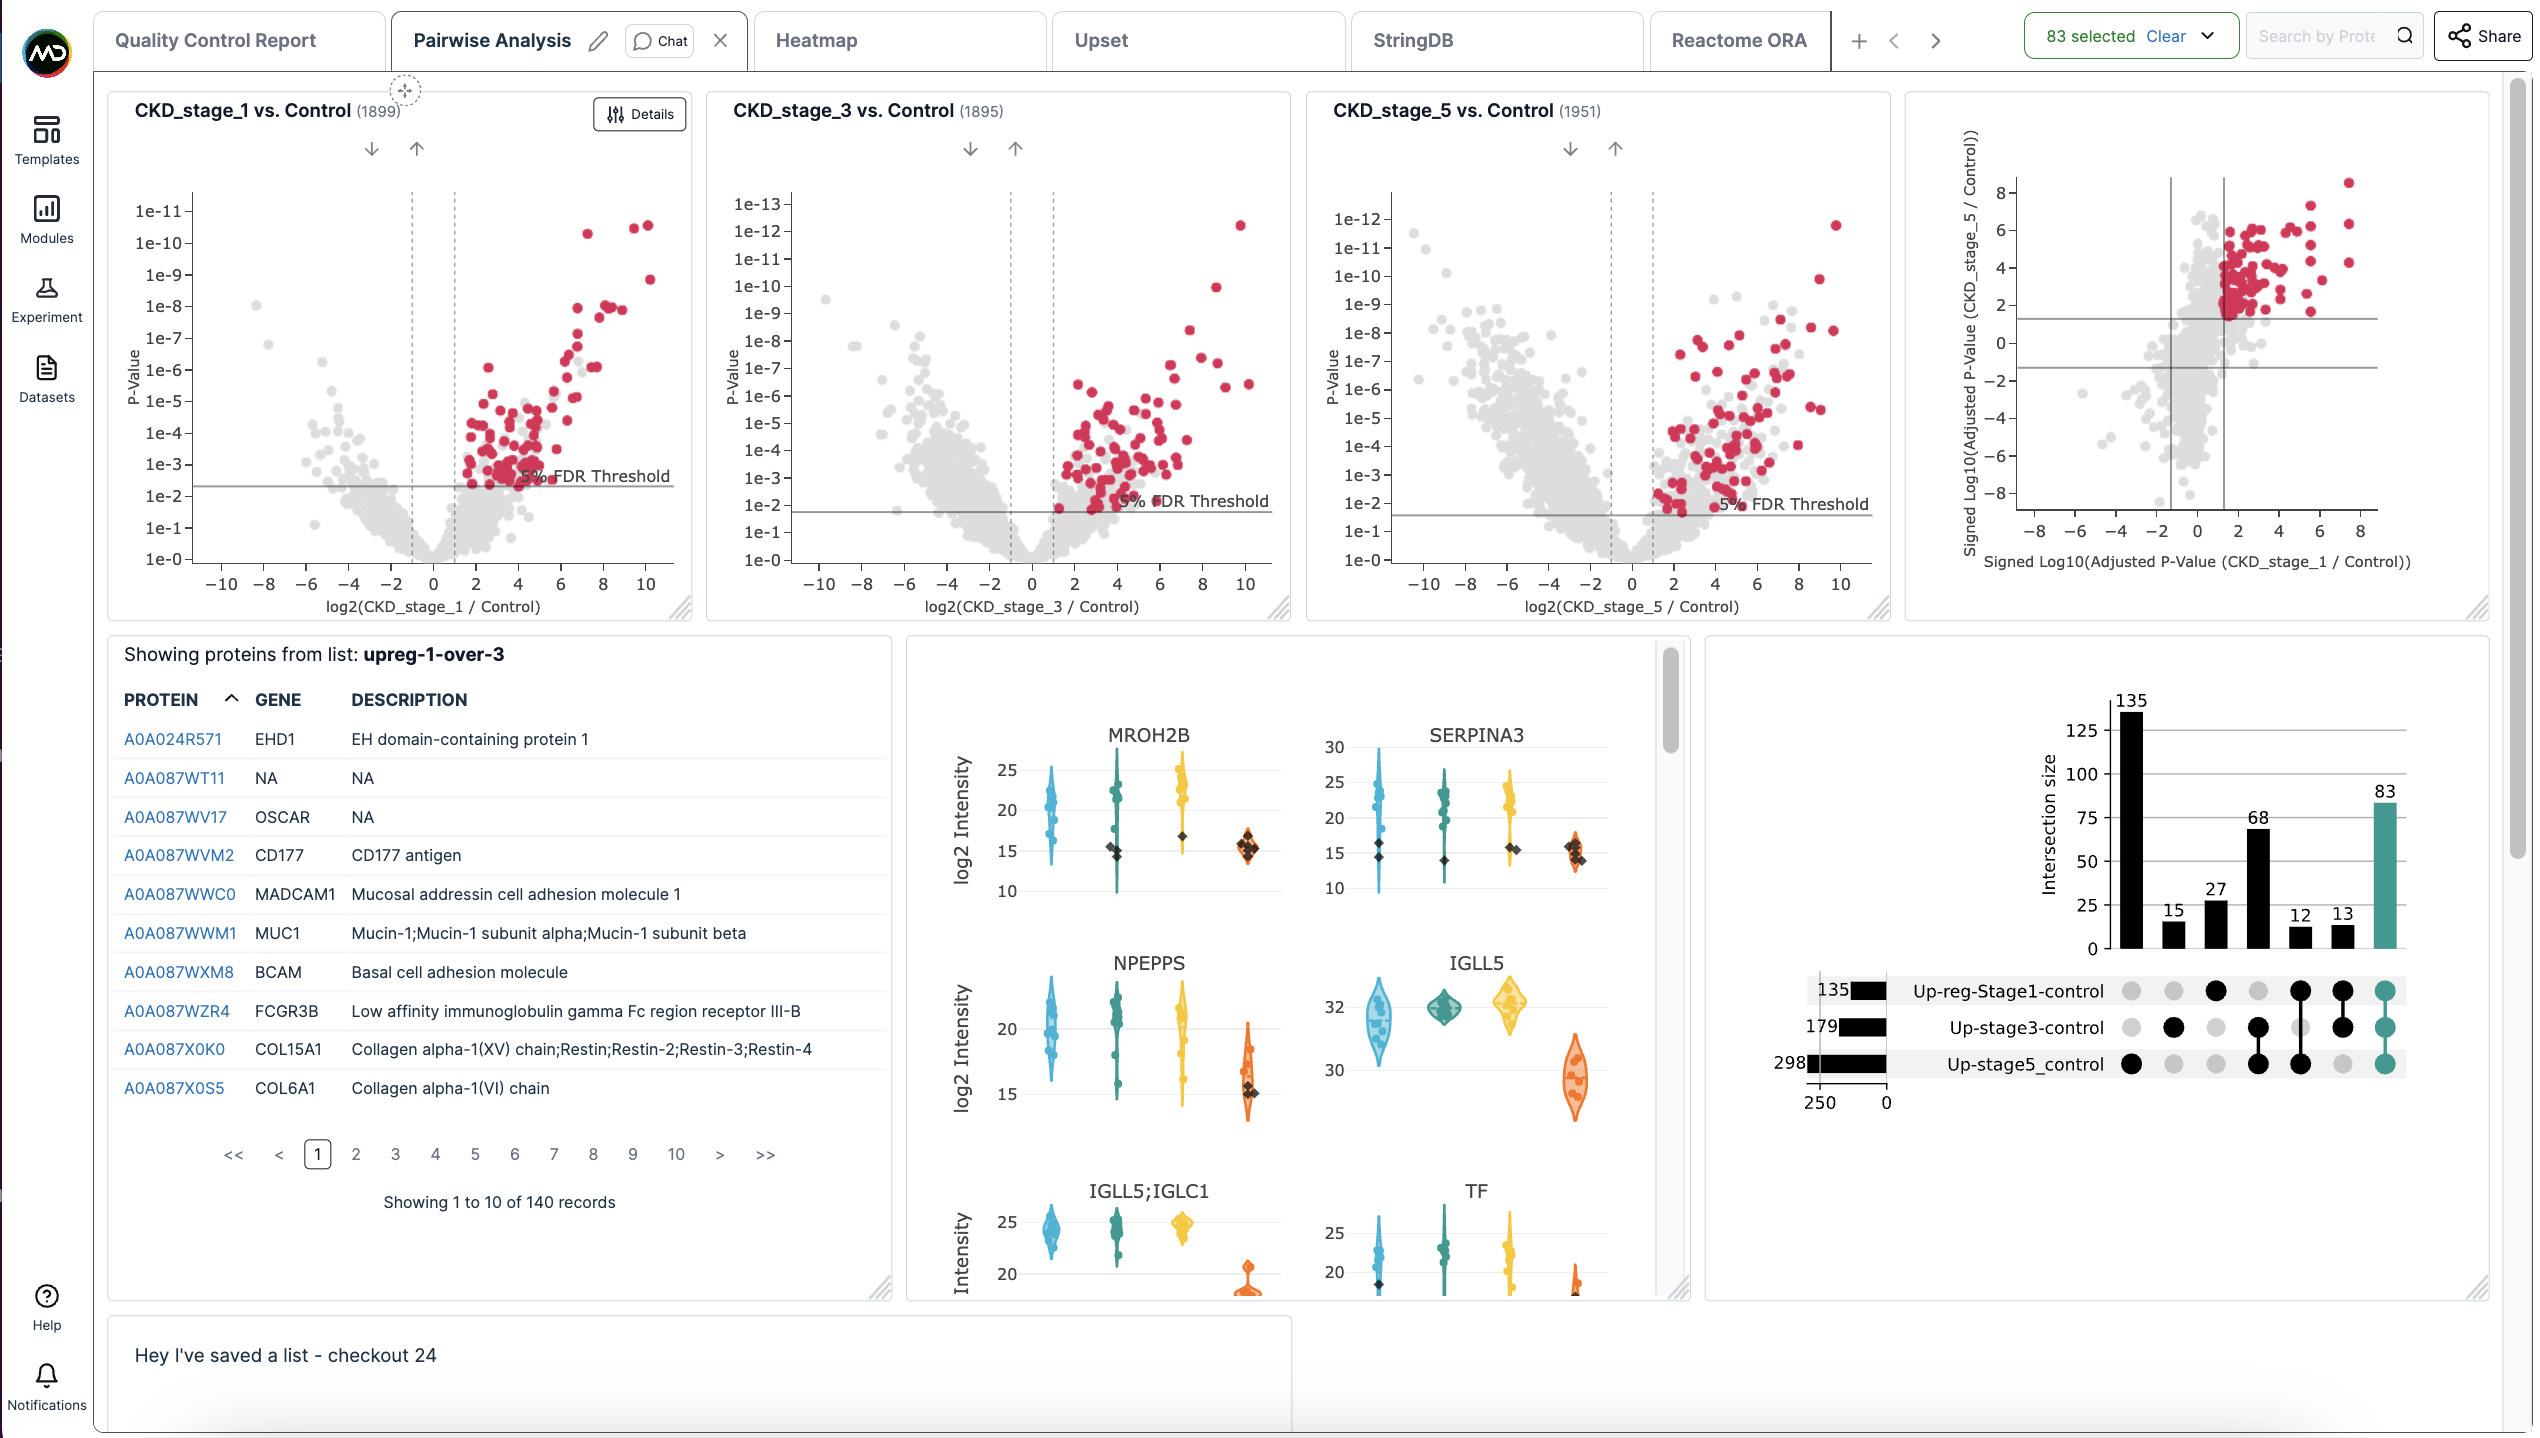
- Interactivity: We've focused on developing a human-focused interface that not only automatically generates various plots, but provides the ability to track how protein intensities behave across each visualization. For example, the demo screenshot below shows how proteins selected across one plot are automatically shown in other modules (in this instance, other volcano plots showing pairwise comparisons, a log-log plot, violin plot, and upset plot.
- Built-in reproducibility: Standarised workflows and interfaces enables greater consistency and reproducibility.
- Enterprise-level Security and Support: Surpasses industry and academic standards. Offers technical and educational support, alongside expanding self-service resources.
- Education: The statistics and visuals are provided with information about what the analysis is trying to present. This considers providing information for all stakeholders, irrespective of their background and understanding of proteomics.
- Data storage: The subscription stores your data analyses, and provide functionality in the app to interrogate across your experiments - e.g. use out protein tracer plot to see how proteins have behaved in different studies/experiments
- Integrated knowledge: We allow you to more easily link external knowledge bases (e.g. Reactome, STRING) so you can see how pathways and proteins behave in the context of your experiment
- Sharing and Collaboration:
- You can share your results with anyone through their email (they don't need to have a subscription),
- You can use this to communicate - add notes, comments, and checklists,
- The service sends emails to inform your collaborators when you comment on any analysis or visual in the experiment, and
- You can make experiments publicly available and add this link to publications (as a read-only version) for anyone to interrogate